Statistics
The Statistics screen is your personal analytics dashboard. It provides detailed charts and visualizations of your activity data, helping you understand your habits, patterns, and trends over time.
Accessing Statistics
Tap the Statistics tab (📊 chart icon) on the bottom navigation bar.
Available Charts
The Statistics screen offers 8 different chart sections. Each section can be individually shown or hidden via Settings → Statistics Customization.
🕸️ Sex Profile (Radar Chart)
A multi-axis radar chart analyzing your last 30 days of activity across 5 dimensions:
| Axis | What it measures |
|---|---|
| Rating | Average rating as a percentage of 5 stars |
| Toy Usage | Percentage of activities that included toys |
| Frequency | Percentage of days you were active |
| Orgasms | Percentage of activities where you had an orgasm |
| Long Sessions | Percentage of activities lasting 30+ minutes |
The chart shows two overlays — one for sex activities and one for masturbation activities — so you can compare your habits side by side.
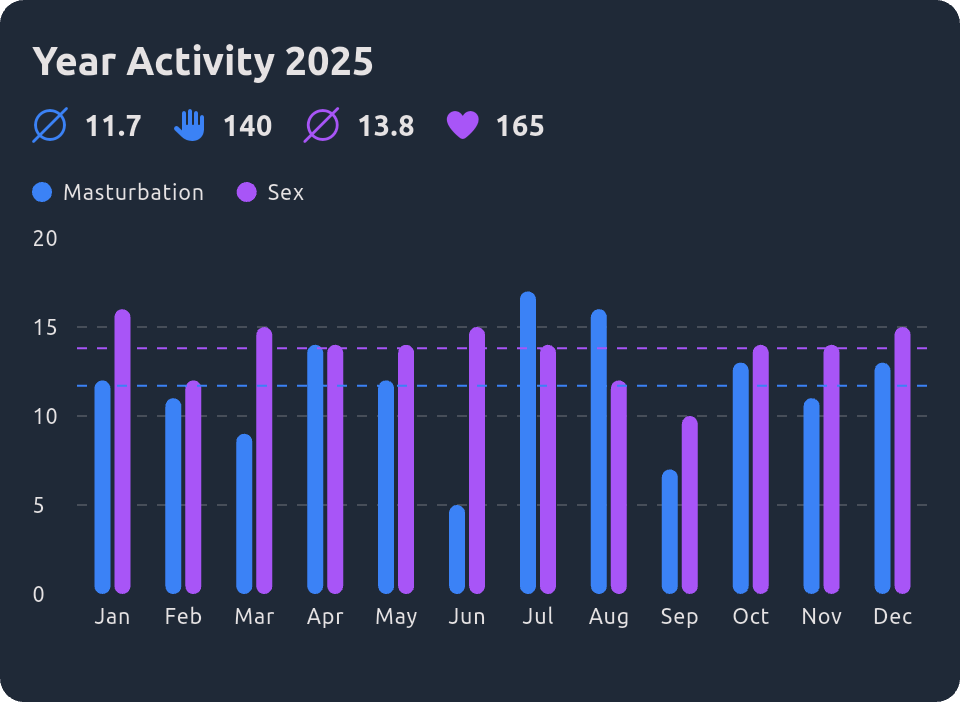
Year Overview (Bar Chart)
A bar chart showing the number of activities per month for the current year. Activities are color-coded:
- Purple — Sex activities
- Blue — Masturbation activities
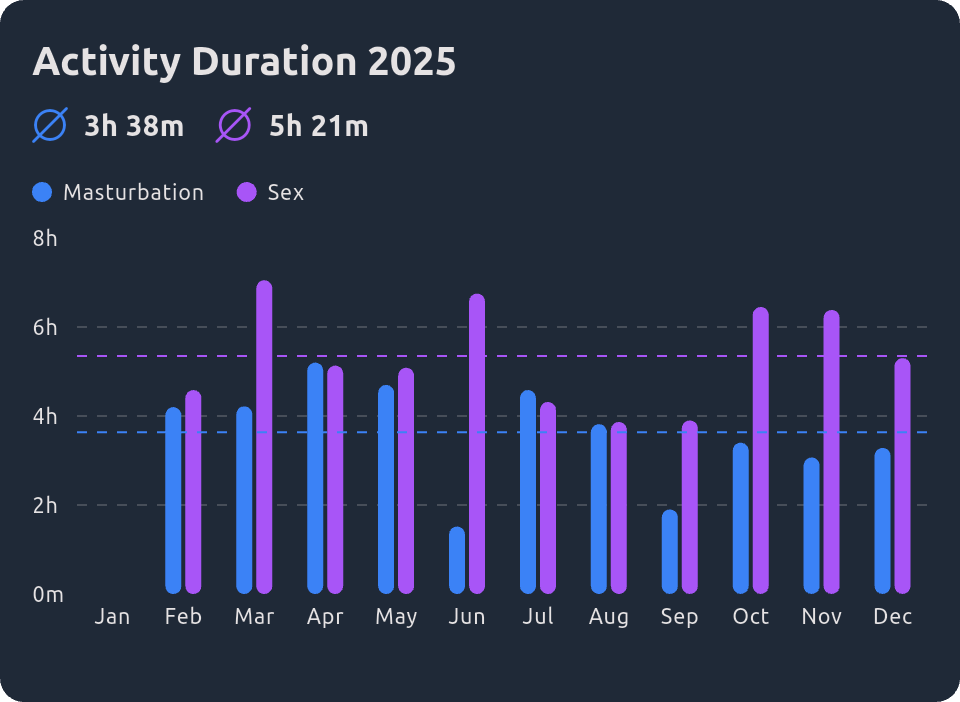
Year Overview Duration (Bar Chart)
Similar to the year overview, but showing total duration per month instead of activity count.
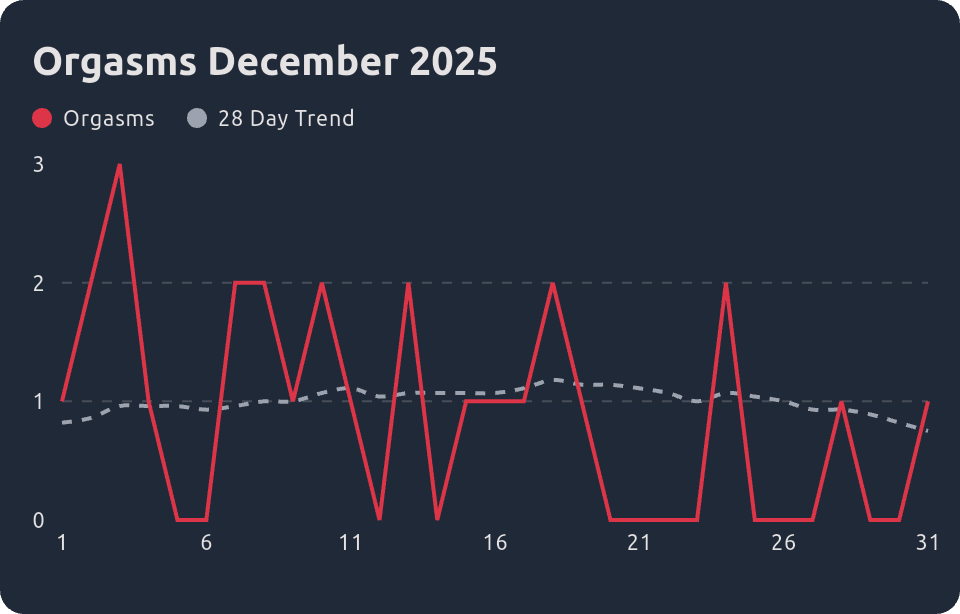
Month Overview Orgasms (Line Chart)
A line chart showing orgasms per day within the current month.
Month Overview (Line Chart)
A line chart showing cumulative activity growth within the current month — how your activity count builds up day by day.

Week Average (Line Chart)
A line chart showing your average activity count per day of the week (Monday through Sunday). This reveals which days you're most active.

Time of Day (Bar Chart)
A bar chart showing how your activities are distributed across the four time slots:
- Morning (6 AM – 12 PM)
- Afternoon (12 PM – 6 PM)
- Evening (6 PM – 12 AM)
- Night (12 AM – 6 AM)

Rating Distribution (Bar Chart)
A bar chart showing how many activities you've given each rating (1 through 5 stars).

Customizing Statistics
You can choose which charts are visible on your Statistics screen:
- Go to Settings → Statistics Customization
- Toggle each chart section on or off
- Your preferences are saved and persisted
This lets you focus on the charts that matter most to you and hide the ones you don't use.
Data Included
Statistics include both your own activities and participated activities (from linked friends/partners). This gives you a complete picture that includes all your sexual experiences, regardless of who logged them.